How a three-node streaming-replication cluster, a Layer-4 proxy, and one very opinionated planner setting turned a contended database into a read tier that stays out of its own way.
Table of contents
Open Table of contents
- The problem: one database, two very different workloads
- Why replicas and not shards
- How the replication actually works
- The part where I tell you what it costs
- Routing reads: HAProxy at Layer 4
- Making each node faster
- Indexes that know about soft deletes
- Rearranging physical disk layout
- Measuring a cluster vs. measuring a single node
- The layer above: HTTP edge caching
- Architectural takeaways
The problem: one database, two very different workloads
I have a dataset of about 3.5 million rows across 17 tables — a decade-plus of basketball telemetry. Box scores, shot coordinates, advanced metrics, season aggregates. Roughly 3,500,000 rows sounds small until you notice what’s being asked of them.
Two completely different kinds of work were hitting the same Postgres instance:
- Writes: nightly ingestion. Bulk loads, upserts, derived-table rebuilds.
- Reads: an API serving analytical queries. “Every player’s advanced stats for the 2023 playoffs.” “All 366,601 shot coordinates for this player, by season.” Queries that scan wide and aggregate.
On a single node, these two don’t coexist politely. A long analytical scan holds buffers and CPU; the ingestion job wants to write. Neither is doing anything wrong — they’re just competing for one machine’s worth of everything.

The workload has one property that makes this very fixable: it is overwhelmingly read-heavy, and the reads tolerate being a little bit stale. Nobody is harmed if a shot chart is 200 milliseconds behind the primary. That single observation is what the entire architecture is built on.
Why replicas and not shards
The instinct when a database gets busy is to reach for sharding. I didn’t, for a boring but decisive reason: sharding solves a data-size problem, and I don’t have one.
3.5M rows fit comfortably on one machine. What I have is a concurrency problem — too many readers competing with writers on one set of resources.
Sharding would have cost me cross-shard joins, a routing layer that understands my schema, and a complex rebalancing story. Read replicas cost me one thing — a bounded amount of staleness — and I’d already established I could pay it.
So: one primary, two hot standbys, physical streaming replication.

All the analytical reads move off the primary. The primary goes back to doing one job.
How the replication actually works
“Streaming replication” gets hand-waved a lot, so it’s worth being concrete, because the details are exactly where the tradeoffs live.
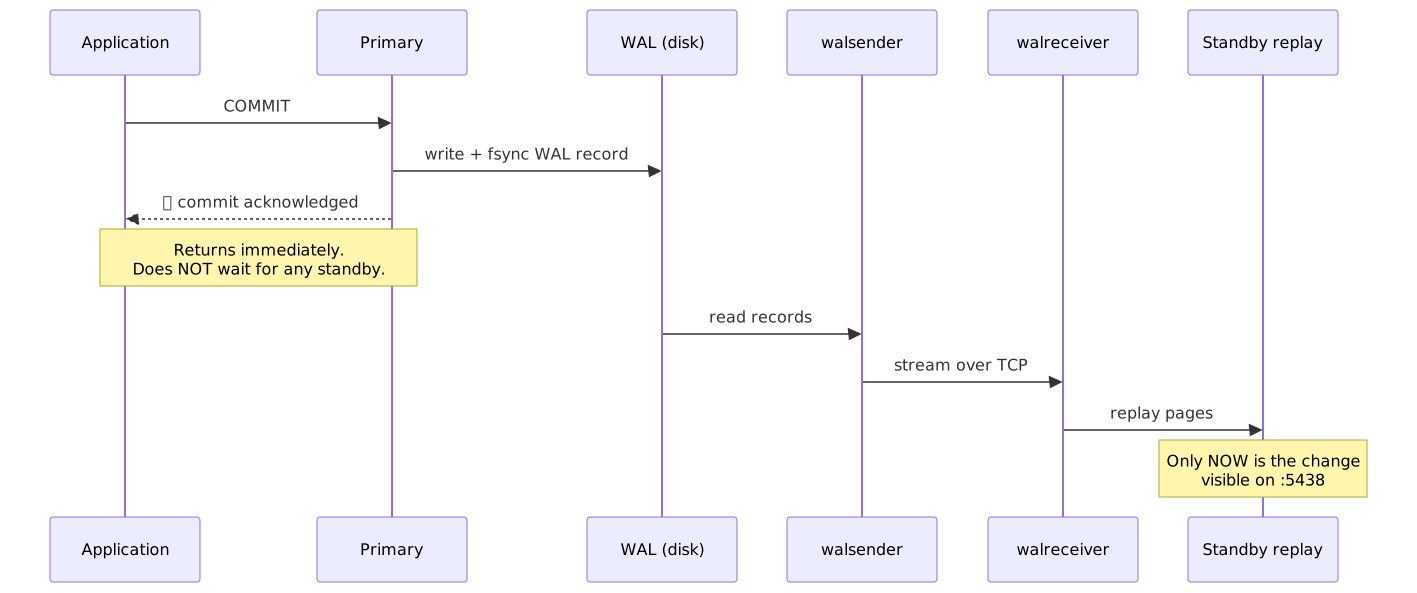
Postgres already writes every change to a Write-Ahead Log (WAL) before touching the actual data files. That’s a durability mechanism — it exists so a crashed server can recover. Physical replication is the realization that this log is also a perfectly good change feed. If a second server replays the same WAL records, it ends up byte-for-byte identical to the first.
The key word is physical. The standby isn’t re-running your SQL. It’s applying page-level changes — “in file 16384, block 412, these bytes become those bytes.” There’s no parsing, no planning, and no re-executing expensive aggregates. That’s why a standby can easily keep up with a primary it could never out-compute.
Replication slots: the thing that stops it from silently breaking
There’s an obvious failure mode: the primary recycles old WAL files once it no longer needs them. If a standby is disconnected — network blip, reboot, maintenance — and the primary recycles WAL that the standby hadn’t consumed yet, the standby can never catch up. It has to be rebuilt from scratch.
Replication slots fix this. A slot is a bookmark the standby registers on the primary: “I have consumed up to LSN X; don’t throw away anything past that.” The primary retains that WAL until the standby confirms it’s been consumed.
primary/init-primary.sh creates them before any standby exists:
  replica1_slot  →  claimed by pg_replica1
replica2_slot → claimed by pg_replica2A replication slot without limits is a loaded gun pointed at your disk. An offline standby means a primary retaining WAL indefinitely — until the disk fills and the primary crashes. A safety feature that takes down production is not a safety feature.
To prevent this, retention is bounded on both ends:
| Setting | Value | What it does |
|---|---|---|
wal_keep_size | 1GB | Floor — always keep this much WAL, slot or not |
max_slot_wal_keep_size | 2GB | Ceiling — a slot may never hold more than this hostage |
Past 2GB, the primary invalidates the slot and moves on. That standby now needs a rebuild — which is a bad afternoon, but a bad afternoon is strictly better than an unrecoverable disk crash on the primary at 3am. The failure was made loud and local instead of quiet and catastrophic.
Bootstrapping a standby
A new standby clones itself with one command:
pg_basebackup -h "$PRIMARY_HOST" -p 5432 -U replicator \
  -D "$PGDATA" -c fast -R -X stream -S "$REPL_SLOT"
Four flags doing real work:
-R: writesstandby.signalandprimary_conninfo, so the node boots knowing it’s a standby and who to follow.-X stream: streams WAL concurrently with the base backup. Without it, WAL generated during a long copy could be recycled before the backup finishes. This flag makes unattended bootstrapping work reliably.-S: binds the clone to its pre-created slot, ensuring WAL retention is protected from the very first byte.-c fast: forces an immediate checkpoint instead of waiting for the next scheduled interval.
The script only runs this when $PGDATA/PG_VERSION is absent. Restarting a healthy standby resumes streaming; it doesn’t re-clone 3.5M rows.
The part where I tell you what it costs
Here’s what most architecture write-ups skip. This replication is asynchronous. synchronous_standby_names is deliberately unset. Looking at the sequence diagram again: the primary acknowledges your commit before any standby has seen it.
That buys throughput — commit latency never depends on a replica’s disk or the network between them. It costs two specific things, and you should understand both before copying this design:
- A primary failure can lose recently committed transactions. If the primary dies with WAL that hasn’t reached a standby, those commits are gone. For nightly-ingested analytics data that’s recoverable — I re-run the ingest. For payments, it is not. This is a workload-specific tradeoff, not a universally correct one.
- Read-your-writes is not guaranteed. Write a row through
:5437, immediately read through:5438, and you may not see it. The fix is straightforward: reads that must observe a just-completed write go directly to the primary. You spend a tiny slice of primary capacity to buy correctness where it actually matters.
Measured lag on this cluster runs at 0 bytes, with replay lag around 0.0006 seconds — sub-millisecond. That’s a measurement under a specific load, not an absolute guarantee. The architecture promises eventual consistency; the benchmark confirms that “eventual” is practically instantaneous under normal operation.
Letting standbys protect their own queries
One more setting worth understanding: hot_standby_feedback = on.
The conflict it solves is subtle. Vacuum on the primary removes old row versions it believes nobody needs. But a long analytical query on a standby might still be reading those versions. When the deletion replays, Postgres faces an impossible choice and cancels the standby query — the infamous "canceling statement due to conflict with recovery".
With feedback turned on, each standby continuously reports its oldest running transaction back to the primary, and the primary declines to vacuum away anything still in use.
A long-running query on a standby now delays vacuum on the primary, which can lead to table bloat. That’s why make table-bloat exists in the operational tooling. You trade hard query aborts for soft, monitorable vacuum delay.
Routing reads: HAProxy at Layer 4
Something has to decide where each query goes. I used HAProxy in mode tcp — Layer 4. It forwards raw bytes. It does not parse the Postgres wire protocol, doesn’t know what a SELECT is, and adds well under a millisecond of overhead.
The alternative — a Layer 7 proxy that inspects SQL and routes automatically — is appealing until you think about edge cases. An L7 router must correctly classify every statement, including CTEs that write, stored procedures with side effects, and SELECT ... FOR UPDATE. Get one wrong and you send a write to a read-only replica, or silently serve stale data to code expecting immediate consistency.
I’d rather the application state its intent explicitly than have a proxy guess. The split is expressed cleanly through two ports:

Two pgxpool connection pools, one per port. The application code decides:
| Pool | Min | Max | Target | Rationale |
|---|---|---|---|---|
Write Pool (:5437) | 5 | 25 | Primary | Single backend node |
Read Pool (:5438) | 10 | 50 | Standby 1 & 2 | Fans out across two nodes via round-robin |
The read pool is twice the size because it spreads over two standbys — maintaining roughly the same per-node connection count. Sizing connection pools without accounting for fan-out is an easy way to accidentally saturate a single node.
Timeouts are also customized: timeout connect 5s, but timeout client and timeout server are set to 30 minutes. For analytical workloads, a heavy aggregation running for four minutes is doing legitimate work; a proxy that kills queries after 60 seconds would break the application.
What the health check does and doesn’t catch
Let’s be candid about failure boundaries:
- TCP Probes: The backends use a standard
checkprobe (inter 2s,fall 3). A node that stops accepting connections leaves rotation in ~6 seconds. - Replay Lag Blind Spot: The TCP probe only tests socket acceptance. It cannot detect a standby that accepts connections but has stalled on WAL replay. A deeper health check should inspect
pg_last_wal_replay_lsn()relative to the primary. - No Automatic Primary Promotion: If the primary dies, writes stop until a human acts. This is a read-scaling architecture with high read availability — not an automated-failover HA system with consensus fencing (like Patroni).
Making each node faster
Scaling out gave me three nodes. The next step was making each individual node efficient. Every setting below is applied identically to all three nodes:
| Setting | Value | Reasoning |
|---|---|---|
shared_buffers | 1GB | Postgres-managed buffer cache |
effective_cache_size | 3GB | Planner’s estimate of total OS + PG page cache (not an allocation) |
work_mem | 16MB | Per-operation sort/hash budget before spilling to disk |
maintenance_work_mem | 128MB | Accelerates CLUSTER, VACUUM, and index builds |
random_page_cost | 1.1 | Tailored for fast NVMe storage |
effective_cache_size doesn’t reserve memory. It is a cost hint. Telling the planner “3GB is likely cached” makes index traversals appear cheaper because repeated lookups will hit RAM instead of disk.
The one setting that unlocked everything else
random_page_cost deserves special focus, because getting it wrong quietly invalidates your indexing strategy.
The query planner costs every possible execution path and picks the cheapest. random_page_cost tells it how expensive a random page fetch is compared to a sequential one (seq_page_cost, pegged at 1.0). The default is 4.0.
That default dates back to spinning magnetic disks in the 1990s where random reads required physically repositioning mechanical read heads.
On modern NVMe SSDs, mechanical latency does not exist. Random and sequential lookups perform with near-identical throughput.
Leaving random_page_cost = 4.0 causes the planner to artificially inflate index scan estimates. It looks at a composite index, multiplies estimated costs by 4, decides a sequential scan across 780,000 rows is cheaper, and bypasses the index entirely.

Lowering random_page_cost to 1.1 immediately makes composite and partial index scans viable for the planner. Cost constants describe your hardware to the planner. If the description is wrong, every query plan downstream is wrong.
Indexes that know about soft deletes
Seven composite indexes were created to match precise query predicates:
CREATE INDEX CONCURRENTLY idx_player_adv_season_team_playoff
ON public.player_advanced_stats (season, team, is_playoff)
WHERE deleted_at IS NULL;
Two key design decisions in three lines:
CONCURRENTLY: A standardCREATE INDEXacquires an exclusive lock that halts table writes for the duration of the build.CONCURRENTLYavoids blocking live writes at the cost of an extra table pass.WHERE deleted_at IS NULL: Soft deletes mean deleted rows stay in the table marked with a timestamp. Application queries universally includeWHERE deleted_at IS NULL. A partial index excludes soft-deleted rows entirely, producing a smaller index that fits entirely in cache.
General Principle: An index should model your application access patterns, not just table columns. Rows your queries will never return should never occupy index blocks.
Rearranging physical disk layout
The final optimization works at the physical storage level: where rows are stored on disk blocks.
Consider a core query pattern in this API: “Fetch all player box score records for these 50 games.”
SELECT * FROM public.player_game_adv_stats
WHERE game_id IN ($1, $2, ... $50);
With 25–30 player records per game, this query fetches ~1,400 rows. While an index locates these records instantly, fetching them is another matter.
Rows are stored in the heap in insertion order. Ingested chronologically over many seasons, records for a single game are scattered across hundreds of distinct 8kB pages. Fetching 1,400 scattered rows requires reading hundreds of individual disk blocks.
CLUSTER physically sorts and rewrites the table on disk matching index order:
CLUSTER public.player_game_basic_stats USING idx_player_game_basic;
CLUSTER public.player_game_adv_stats   USING idx_player_game_adv;
With indexes keyed on (game_id, player_id), every player row for a game is stored contiguously on disk:
BEFORE — rows for game 1001 scattered by insertion order
┌──────────┬──────────────────────────────────────────────────┐
│ block 412│ g:7742 p:31 │ g:1001 p:08 │ g:3390 p:12 │ ...    │  ← 1 useful row
│ block 413│ g:2245 p:55 │ g:0908 p:04 │ g:5511 p:77 │ ...    │  ← 0 useful rows
│ block 587│ g:1001 p:23 │ g:6134 p:19 │ g:2245 p:02 │ ...    │  ← 1 useful row
│   ...    │  ~28 rows spread across hundreds of blocks        │
└──────────┴──────────────────────────────────────────────────┘

AFTER — CLUSTER on (game_id, player_id)
┌──────────┬──────────────────────────────────────────────────┐
│ block 88 │ g:1001 p:04 │ g:1001 p:08 │ g:1001 p:12 │ ...    │  ← all useful
│ block 89 │ g:1001 p:23 │ g:1001 p:31 │ g:1002 p:03 │ ...    │  ← all useful
│   ...    │  ~1,400 rows in ~20–30 blocks                     │
└──────────┴──────────────────────────────────────────────────┘
Hundreds of block reads collapse down to 20–30 pages. The query logic didn’t change; only the physical layout changed.
Visibility maps and index-only scans
After clustering, we run VACUUM (ANALYZE) across all tables:
VACUUM (ANALYZE) public.player_game_basic_stats;
VACUUM (ANALYZE) public.player_game_adv_stats;
VACUUM updates the visibility map, which tracks blocks containing only rows visible to all current transactions. When the visibility map confirms a block is all-visible, queries with covering indexes perform Index-Only Scans, bypassing heap block reads completely.
CLUSTERacquires anACCESS EXCLUSIVElock while rewriting the table. Run this during scheduled maintenance windows.- Postgres does not preserve clustering on new writes. It is a periodic maintenance task that should be re-run as tables accumulate new data.
Measuring a cluster vs. measuring a single node
A common profiling pitfall:
PostgreSQL statistics views (
pg_stat_statements,pg_stat_io) are per-node and stored in local memory. They do not replicate over WAL.
If you query pg_stat_statements on the primary, you only see write queries and miss 95%+ of your query workload running on standbys.
Diagnostic tooling must query both pools simultaneously:
make top-queries      # Slowest queries: read pool (:5438) AND primary (:5434)
make cache-health     # Buffer cache hit ratios per node
make io-stats         # pg_stat_io breakdown per node
make table-bloat      # Dead tuples (measuring hot_standby_feedback impact)
make reset-stats      # Clears statistics counters on ALL THREE nodes
Running make reset-stats across all three nodes before load testing ensures benchmark baselines match across the entire cluster.
The layer above: HTTP edge caching
In front of the database tier sits a Go API equipped with an edge-cache middleware that emits Cache-Control headers based on resource volatility:
| Strategy | Browser Cache | Edge Cache (CDN) | Applicable Content |
|---|---|---|---|
Immutable | 1 day | 30 days | Historical games, static shot charts |
SemiDynamic | 60 seconds | 1 day | Season leaderboards, aggregates |
Realtime | 5 seconds | 10 seconds | Live, in-progress games |
NoCache | — | — | Mutations, authenticated sessions |
The middleware automatically forces no-store on any non-GET/HEAD method regardless of configured strategy. This prevents an accidental cache annotation on a mutation route from poisoning edge nodes.
Under a 300-request benchmark, the combined stack delivered an average latency of 64ms at 295 req/s with 100% success. The database optimizations ensure cache misses remain fast and lightweight.
Architectural takeaways
What this design delivers:
- Horizontal Read Scaling: Add standby replicas to increase read throughput linearly.
- Read High Availability: If a standby fails, HAProxy removes it within 6 seconds while the remaining standby carries traffic.
- Predictable Write Performance: The primary handles zero analytical load.
- Deterministic Query Plans: Identical planner parameters across all nodes prevent plan drift across connection pools.
Trade-offs and non-goals:
- Manual Failover: Primary downtime requires human intervention or an external consensus orchestrator (e.g. Patroni).
- Eventual Consistency: Asynchronous replication may exhibit brief sub-millisecond replication lag.
- TCP Health Checks: Socket checks do not detect WAL replay stalls.
- Periodic Maintenance: Clustering order decays over time and requires periodic maintenance.
The complete cluster runs PostgreSQL 17 and HAProxy 2.9 in Docker Compose.